Realty Executives of Northern Arizona
So, Where are we today, Here in Flagstaff in our Housing Market?
I can tell you where we are today, the end of the month March, 2020, and can even show you where we were in March of 2009.
What I cannot say with these uncertain times, where we are going, so will use History as a guide.
I will also include the research below, 'Think This is a Housing Crisis? Think Again', which came from a Real Estate Research company that helps me stay current with the Real Estate Market. You will find this an interesting read.
March was a bright spot with sales up from the previous year, but these sales were generated from pending contracts in January and February before the Covid-19 event started to take effect.
A look past to maybe see the future;
One line below talks about Absorption Rate, the number of months it takes at the current average sales rate to sell all the homes on the market. The Experts in the Real Estate field feel a 6-7 month supply makes a healthy market, any more, we are in a buyers market, any less we are in a sellers market and to few means we have pent up demand from those that cannot find a home to purchase.
Here is some history going back to March of 2009 compared the the end of March this year, 2020.
| March 2009 | Today- March 2020 | ||
| Absorption Rate | 12.03 Months | 3.22 Months | |
| Homes Sold in March | 67 | 119 | |
| Active Homes on the Market, End of March | 891 | 443 | |
| Pending Homes that came to the Market in March | 67 | 49 | |
| FreddieMac Monthly Average 30 year Fixed, with .7 pts | 5.00% | 3.45% | |
| March 1 to April 13 2019 | March 1 to April 13 2020 | ||
| Number of Showings in Flagstaff | 1879 | 1427 | |
| Decrease in Showings of -24.05% | |||
| 2019 | 2020 | ||
| A Weekly Average of showings starting Jan 12 | +35% increase in Showings | -45% decrease in showings | |
Here is what the above is showing us;
When we compare 2020 to 2009, we are selling far more homes, we have far fewer homes on the market and interest rates are far below 2009.
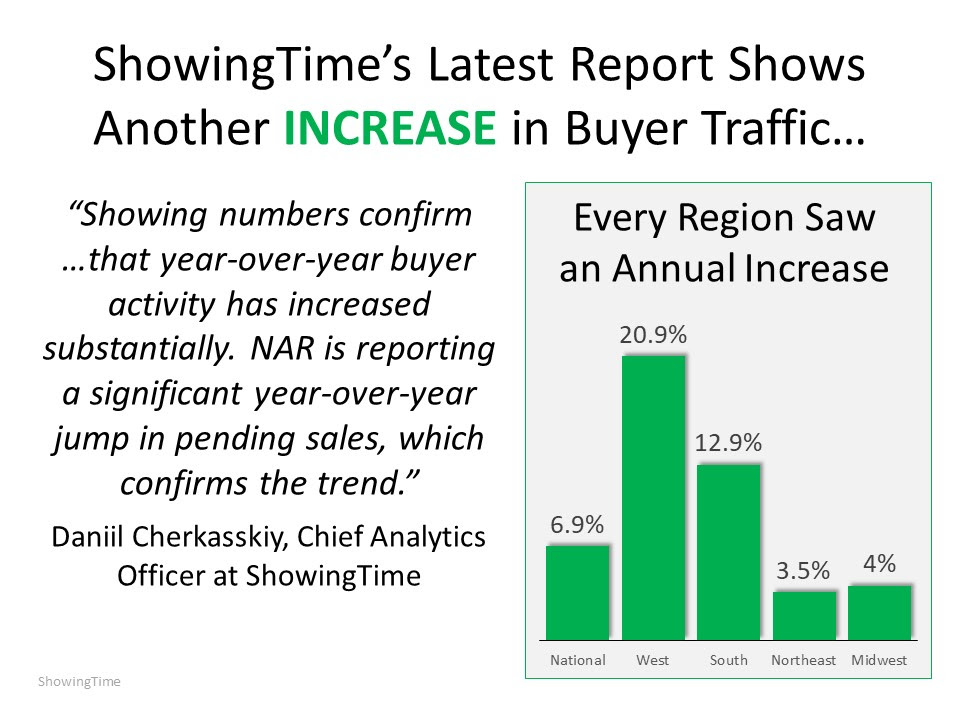
Showings are down both in Flagstaff and Statewide, Buyers are certainly holding back waiting to see what happens. When the time comes, those that were waiting will jump back into the market and in numbers.
Today and the past recession are two different animals,
We have far fewer homes on the market, interest rates are well below the 2009 rates, and demand for homes thru February has been exceptionally strong which was Caused by both low interest rates, low inventory of available homes and pent up demand. The article below lays out a good case that housing will be the leader in bringing back the economy.
With all of the unanswered questions caused by COVID-19 and the economic slowdown we’re experiencing across the country today, many are asking if the housing market is in trouble. For those who remember 2008, it's logical to ask that question.
Many of us experienced financial hardships, lost homes, and were out of work during the Great Recession – the recession that started with a housing and mortgage crisis. Today, we face a very different challenge: an external health crisis that has caused a pause in much of the economy and a major shutdown of many parts of the country.
Let’s look at five things we know about today’s housing market that were different in 2008.
When we look at appreciation in the visual below, there’s a big difference between the 6 years prior to the housing crash and the most recent 6-year period of time. Leading up to the crash, we had much higher appreciation in this country than we see today. In fact, the highest level of appreciation most recently is below the lowest level we saw leading up to the crash. Prices have been rising lately, but not at the rate they were climbing back when we had runaway appreciation.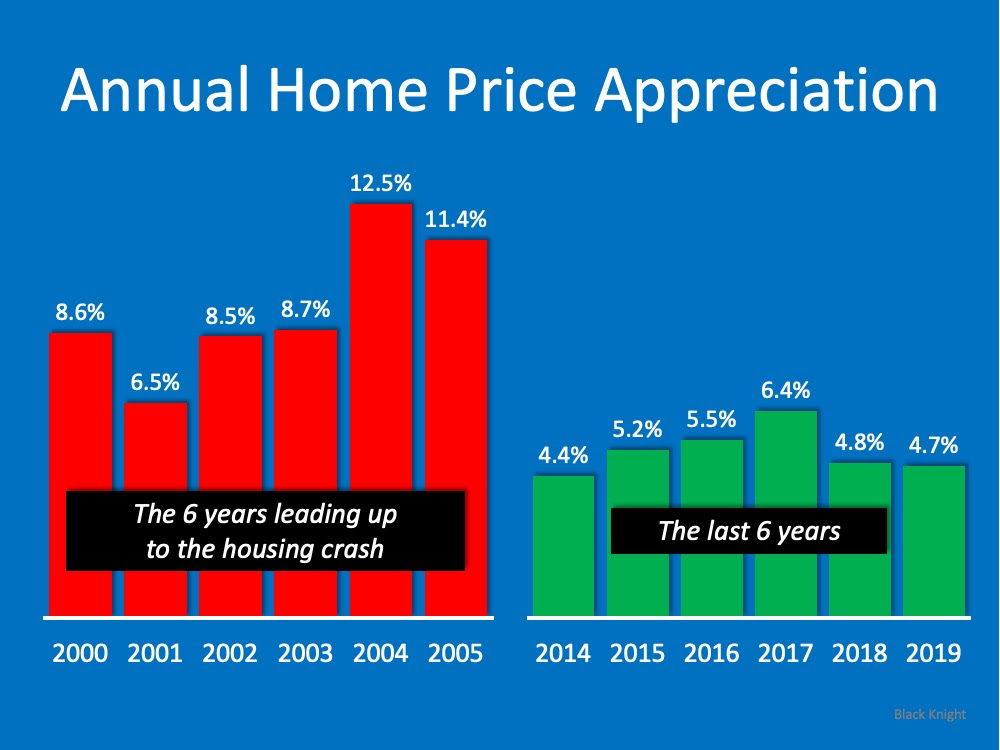
The Mortgage Credit Availability Index is a monthly measure by the Mortgage Bankers Association that gauges the level of difficulty to secure a loan. The higher the index, the easier it is to get a loan; the lower the index, the harder. Today we’re nowhere near the levels seen before the housing crash when it was very easy to get approved for a mortgage. After the crash, however, lending standards tightened and have remained that way leading up to today.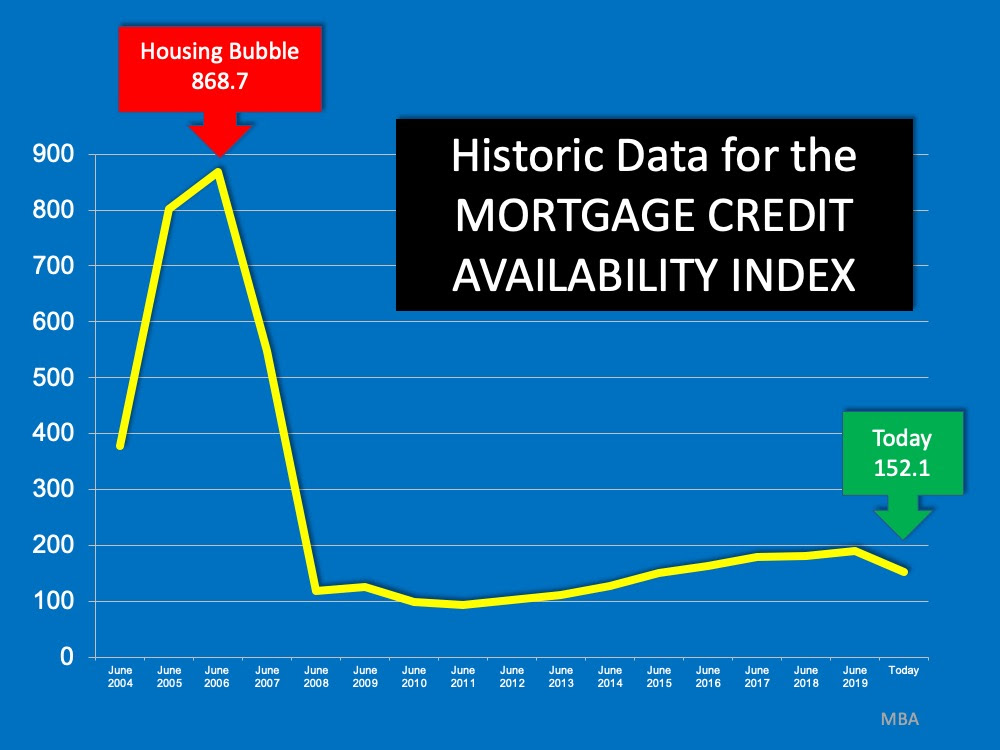
One of the causes of the housing crash in 2008 was an oversupply of homes for sale. Today, as shown in the next image, we see a much different picture. We don’t have enough homes on the market for the number of people who want to buy them. Across the country, we have less than 6 months of inventory, an undersupply of homes available for buyers.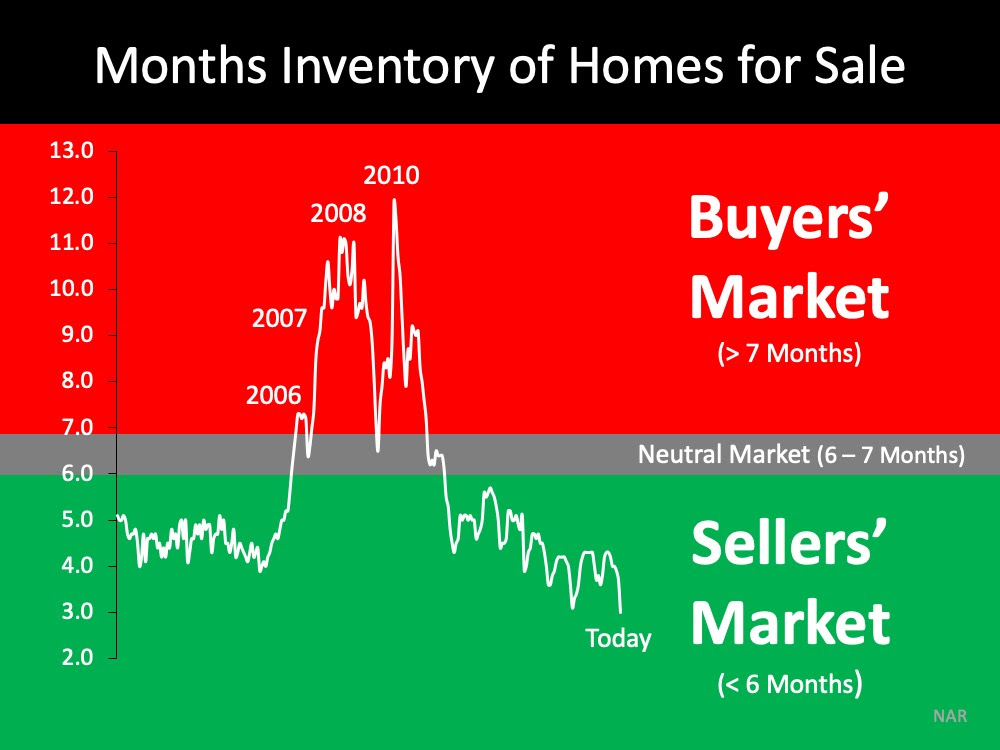
The chart below shows the difference in how people are accessing the equity in their homes today as compared to 2008. In 2008, consumers were harvesting equity from their homes (through cash-out refinances) and using it to finance their lifestyles. Today, consumers are treating the equity in their homes much more cautiously.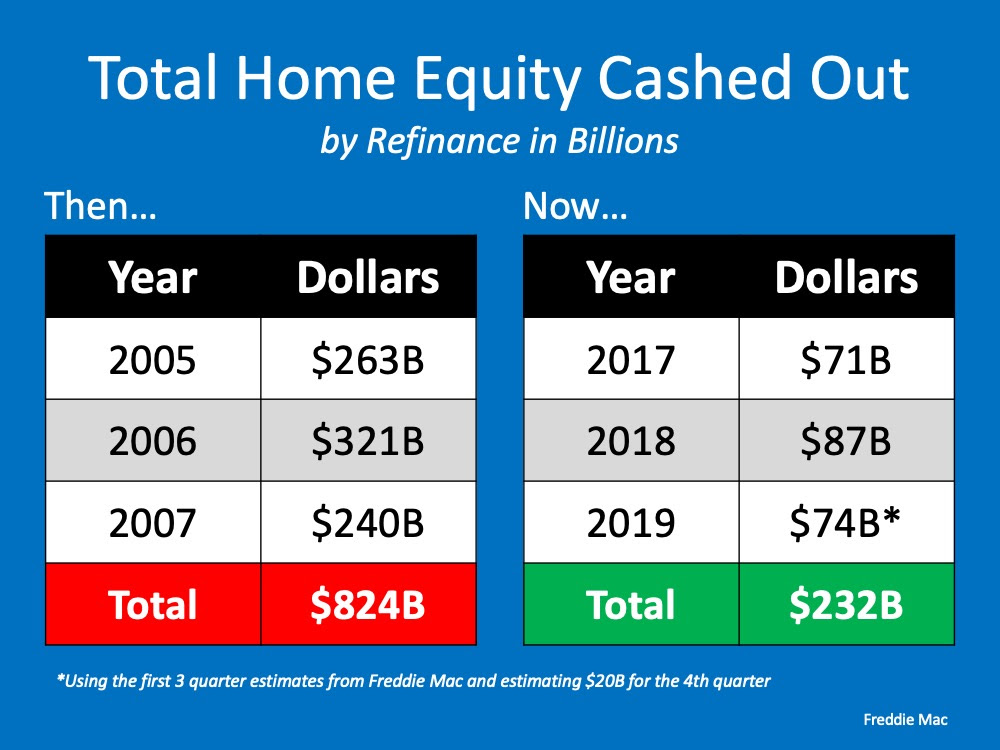
Today, 53.8% of homes across the country have at least 50% equity. In 2008, homeowners walked away when they owed more than what their homes were worth. With the equity homeowners have now, they’re much less likely to walk away from
their homes.
The COVID-19 crisis is causing different challenges across the country than the ones we faced in 2008. Back then, we had a housing crisis; today, we face a health crisis. What we know now is that housing is in a much stronger position today than it was in 2008. It is no longer the center of the economic slowdown. Rather, it could be just what helps pull us out of the downturn.
About the Author:
|
|
February was a good month in Flagstaff, we sold 45.5% more homes than the prior year, and 8.7% more homes came to the market.
Our inventory is still extremely short, hovering around 3.1 month's supply on-hand, where the experts if the Real Estate field feel 6 month's is a good number to reach. We still are in an extreme housing shortage.
For the first two months of the year, we have sold 58.8% more homes, -1.8% fewer homes have come to the market.
Our median prices are hovering at a 7% increase over the prior year.
 |
 |
The housing market is staying extremely strong, driven by two main things, lack of available homes on the market and the incredible mortgage rates that our out there.
Depending on your current mortgage rate, this may be prime time to refinance. Here in Flagstaff, if you would like some suggestions on Great Local lenders, give me a shout, that I can help with.
About the Author:
|
|
People come from miles around to enjoy the outdoor spaces around Flagstaff. Whether you are into biking, camping, skiing, hiking, fishing, history, or all of the above, we’ve got you covered!
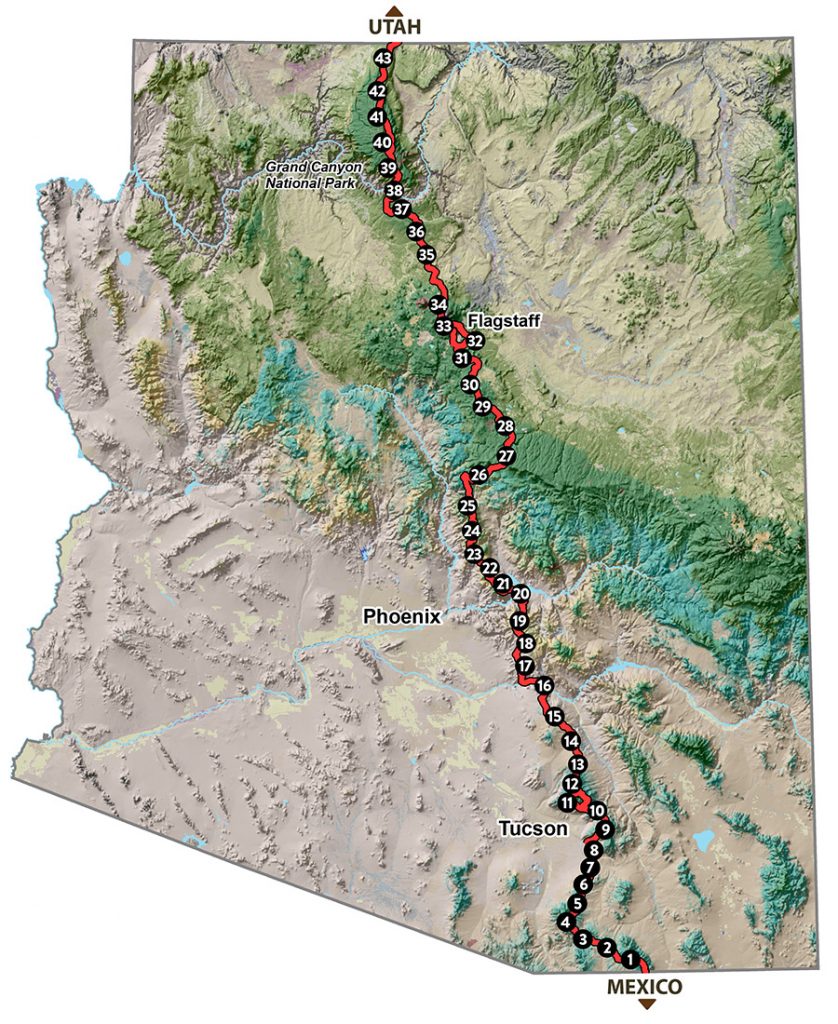
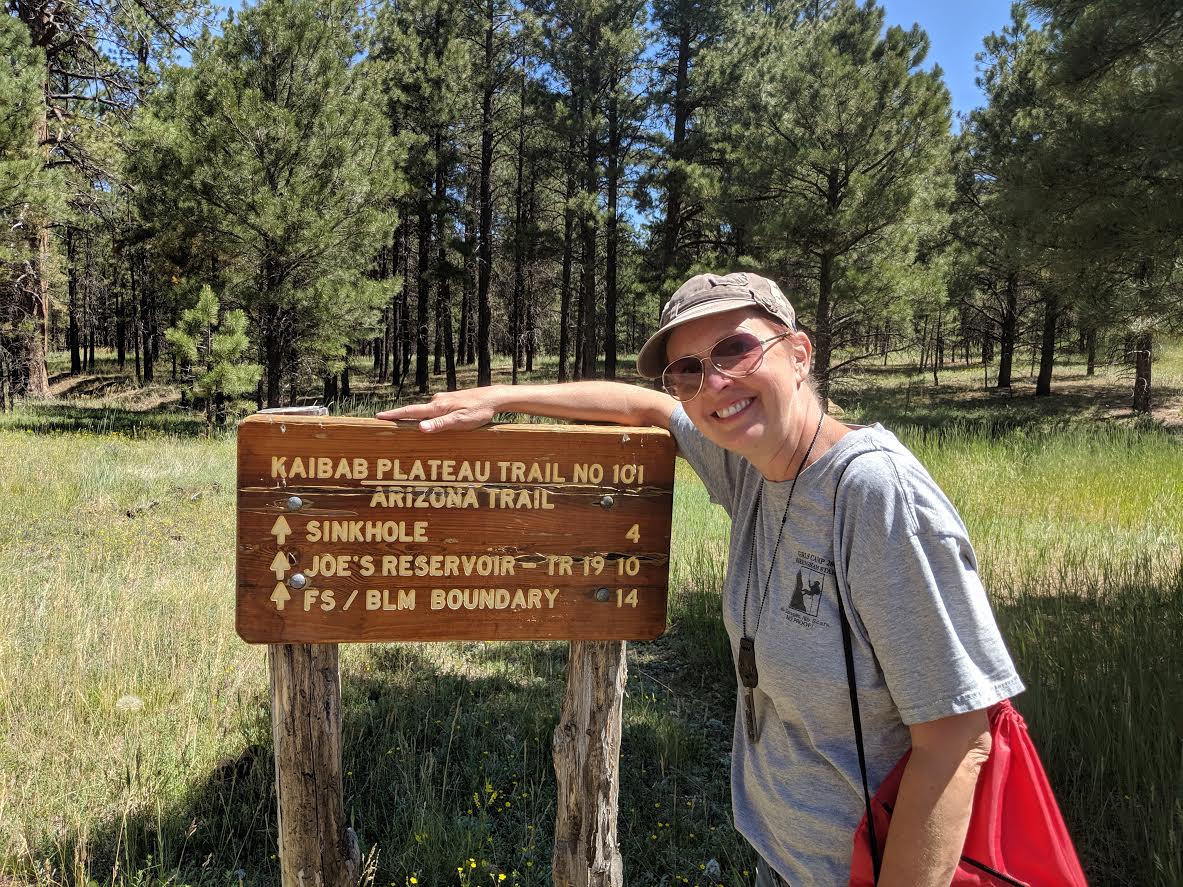
The Arizona National Scenic Trail (AZ Trail, for short) is a complete non-motorized path, stretching 800 diverse miles across Arizona from Mexico to Utah. It links deserts, mountains, forests, canyons, wilderness, history, communities and people. It is the backbone of Arizona, and a beautiful stretch of it runs right through Flagstaff. Its creation was the dream of a Flagstaff schoolteacher, Dale Shewalter. The Trail is maintained by Trail Stewards, incredible volunteers who give their time and talents to keeping the trail in great shape. If you complete the Arizona Trail end to end, you receive a copper belt buckle or pin to celebrate your accomplishment! One of our very own Realty Executives agents is in the process of completing the trail! Previous finishers have included thru-hikers and segment hikers, speed record ultrarunners, yo-yo’s, horseback riders, mountain bikers, and some pioneers who trekked overland long before the AZ Trail was completely built. Wanna know more? Check out: https://aztrail.org/.
 |
 |
 |
If you’re looking to stretch your legs within the city limits itself, check out the Flagstaff Urban Trail System. FUTS encompasses over 50 miles of trails throughout the city and includes areas on all sides of town. You can get just about anywhere around town on foot or by bicycle using these trails! FUTS trails offer an incredibly diverse range of experiences; some trails are located along busy streets, while others traverse beautiful natural places - canyons, grasslands, meadows, and forests - all within the urban area of Flagstaff. The system connects neighborhoods, shopping, places of employment, schools, parks, open space, and the surrounding National Forest, and allows users to combine transportation, recreation and contact with nature.
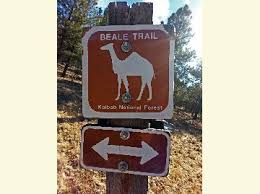
Keep your eyes peeled as you drive in and out of town…camels were once seen here! In 1857, Edward Beale was commissioned by Congress to establish a trade route from Arkansas to California, and he used twenty-two camels (a.k.a. “ships of the desert”) to carry supplies and tools. There are still stretches of his original trail around and outside of town. Some sections of his trail are abandoned, some are still in use, and others have been transformed by railroads, Route 66, and Interstate 40. If you happen across one of the trail markers, you’ll know it by the shape of a camel imprinted on its sign! Want to know more? Check out this pamphlet: https://www.fs.usda.gov/Internet/FSE_DOCUMENTS/stelprdb5434056.pdf
 |
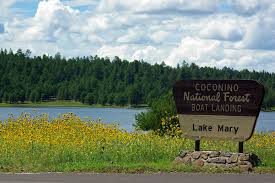 |
Like to spend time on or near the water? Upper and Lower Lake Mary are located just eight miles south from Flagstaff. These long, narrow reservoirs are great for fishing, boating, and bird watching. The boat landing features picnic tables, grills, vault toilets, and a paved boat ramp. There is also the Lake Mary Narrows Picnic Area, where you will find a fishing area with wheelchair access, tables, grills, ramadas and a paved boat ramp.
Once you start exploring all the beauty around Flagstaff, you'll never want to stop!
So, What is Happening in the Flagstaff Market?
It is early in the New Year to talk about any trends, especially when trying to get a gauge on home pricing, but we can talk about the Housing Inventory.
All last year, we talked about the lack of available homes to purchase, the experts in the Real Estate field felt that trend will continue through 2020.
|
But how is Flagstaff doing? Overall we had more homes sales in January, then came to the market. Total number of home sales started off extremely strong in January, up 79% with 93 homes closing compared to 52 the year before.
|
 |
Broken down;
Single Family homes
-8% decrease in the numbers coming to the market or 69 this year, compared
to 75 last year.
121% more home sales, 64 this year, compared to 29 last year.
Condominiums
114% increase in homes coming to the market, 10 this year,
compared to 3 last year.
43% more home sales, 10 this year, compared to 7 last year.
Townhomes
220% increase in homes coming to the market, 32 this year,
compared to 10 last year.
67% more home sales, 15 this year, compared to 9 last year.
Manufactured Homes
150% increase in homes coming to the market, 10 this year,
compared to 4 last year.
43% fewer homes sales, 4 this year, compared to 7 last year.

Looking at the Home Sales for January, normally if we see an increase or decrease in sales, we will see a corresponding change, increase or decrease, the month before in homes coming to the market.
I looked back at November and December 2019, those 2 months for all categories of homes in Flagstaff, we had only 2 additional homes come to the market over the prior year, 4 more in November, 2 less in December.
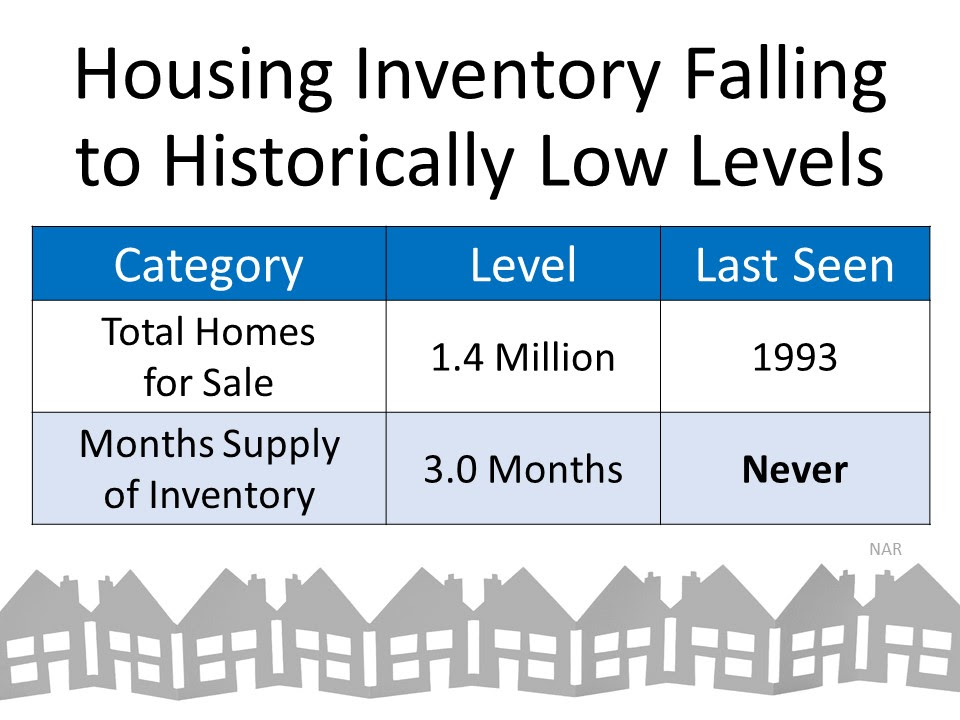
The chart at the left are figures nationwide, showing this is not just a Flagstaff trend.
A combination of better weather and better interest rates definitely helped the Real Estate Market and severely depleted our housing inventory.So, what happened, since the number of homes were not there in the prior months to support a 79% increase in homes sales in January?
When looking at the general Flagstaff area, for all home types, we had 17.2% fewer homes on the market at the end of January this year than last.
We are also sitting at a 2.89 month’s supply on-hand, which could be the lowest we have seen for quite some time, compared to last year 3.53 month’s supply.
The Experts in Real Estate say 6 months is a good even number to strive for, any less, we are in a seller’s market, any higher in a buyer’s market.
|
If you are a Buyer: Inventory is tight and you do not want to make the error of reacting too fast. On the other side of that coin you cannot wait a few days to look at the home you have an interest in. |
 |
If you are a Seller;
Timing is good, maybe the best we have seen for years.
Number of homes on the market are at a level we have not seen for years, interest rates for buyers are low and expected to stay close to our current levels for the remainder of the year.
At one time, we said the key selling season was Spring, Summer and early Fall, but not today!
This is one of the strongest selling markets we have seen in quite some time...
With all this said,
A combination of low inventory and low interest rates may make for an interesting 2020, something we will keep a close eye on as we move through the year.
About the Author:
|
|
The following will be a review of the Flagstaff Real Estate Market for 2019.
As you go through the data, this will be for the General Flagstaff area, including Single Family, Condo, Townhome and Manufactured homes, with a chart below that will give you the additional details.
But first, what about 2020?
From all indications housing should fare well as we move forward.
Unless something happens on the bigger picture world or nationwide, our mortgage rates should be relatively stable for the year, benefiting the buyers a lot.
Housing Supply will remain tight which will benefit the sellers in the lower price categories, which means once buyers have a very good idea of what they are looking for, reaction times to make those offers are limited.
Honestly, for now at least, gone are the days you see something you like today, but wait till the weekend to look at. Unless you see on a Friday, by the time the weekend comes, that home may already be under contract.
If you are considering selling, this will be a good year
If you are considering buying, this will be a good year, but some prior prep work will help you be ready when you find the right home
If you are considering Selling and Buying, there are important steps to take.
In all cases, it will be important to sit down with me, we can work out the best course of action that will benefit you and your family.
Now for a few facts:
Overall homes prices in in Flagstaff rose 5.4% for the year to a Median Price of $390,000 with 1498 homes selling, or an increase of 6.3%.
We did have slightly fewer homes come on the market with a .5% decrease. The Average Days on Market ended up at 104 days, and overall our Month’s Supply of Homes came in at 3.6 months.
To help explain this figure, the experts in Real Estate, say that a 6-month supply is healthy, any higher and we are in a Buyer’s market, any lower we are in a Seller’s market.
Another interesting fact, Cash sales accounted for 21.8% of the homes sold last year, that is down from the year before which was 22.80%. To give you more reference to this figure, going back to 2010, or 10 years ago, that figure was 19.86%.
A little more detail:
Single Family home median prices climbed 7.7%, to $435,000 with 3.6% more homes sold, 107 days on the market, and 20.20% of this home category sold as a cash sale.
Condominium median price climbed .3% to $215,750 with -12.8% fewer homes selling, 79 days on the market, and 32.30% of this home category selling as a cash sale.
Townhome median price decreased -3.9% to $340,000 with -3.8% fewer homes selling, 118 days on the market, and 26.80% of this home category selling as a cash sale.
Manufactured home median price climbed 4.0% to $251,500 with -1.8% fewer homes selling,71 days on the market, and 12.50% of this home category selling as a cash sale.
Some Explanations,
Condominiums- We had fewer homes come to the market, the median price point of $215,750 is the lowest price point for all home categories so highly sought-after homes. Bottom line, with only 163 listing coming to the market, there just was not enough to satisfy the pent-up demand.
Townhomes- this was the only category that the median price point decrease. This was caused by fewer new townhome construction at a higher price point coming to the market. Again, with a much lower price point than single family homes, Townhomes are not keeping up with the buyer demand.
Above we talked a little about ‘Month’s Supply of Homes’.
Overall, we are well below the 6 months supply we would like to have and at 3.6 month’s supply.
A more telling figure is when we look at by price point;
Homes up to $299,999, we have only 2.1 month’s supply
Homes $300,000 to $499,999, we have a 2.7 month’s supply
Homes $500,000 to $699,999, we have a 4.8 month’s supply
Here is where the month’s supply climbs and benefits the buyers
Homes $700,000 to $1,000,000 we have 8.0 month’s supply
Homes over $1,000,000, we have a 16.2 month’s supply.
About the Author:
 |
|